Instrument your Java Code with Micrometer, Prometheus, and Grafana.
Posted on December 31, 2020 in tutorial
Micrometer provides a simple facade over the instrumentation clients for the most popular monitoring systems, allowing you to instrument your JVM-based application code without vendor lock-in. Think SLF4J, but for metrics. - https://micrometer.io/
I'm assuming you have some Java code, and you'd like to instrument it (measure how well it's performing, what is the heap space in current state, are there any exceptions. etc)
With this 3 steps, you'll be up and running in no time.
Step 1: Setup the development environment
Here I am using Docker and Docker compose to set up the environment for simplicity purposes. If you do not have these in your machine, I highly recommend you to install it so that you can follow along.
The full source code is available here: https://github.com/girisagar46/prome-java
First and foremost, I will set Prometheus and Grafana in my docker-compose.yml file.
The docker-compose.yml file looks like this:
version: "3.8"

services:
  prometheus:
    image: prom/prometheus
    container_name: prometheus
    volumes:
      - ./monitoring/prometheus.yml:/etc/prometheus/prometheus.yml
      - ./data/prometheus:/data
    command:
      - "--config.file=/etc/prometheus/prometheus.yml"
      - "--storage.tsdb.path=/data"
    ports:
      - "9090:9090"
    restart: always

  grafana:
    image: grafana/grafana
    volumes:
      - ./grafana:/var/lib/grafana
      - ./grafana/datasources:/etc/grafana/datasources
      - ./grafana/dashboards:/etc/grafana/dashboard
    ports:
      - "3000:3000"
    restart: always
    environment:
      - GF_SECURITY_ADMIN_USER=admin
      - GF_SECURITY_ADMIN_PASSWORD=admin
      - GF_USERS_ALLOW_SIGN_UP=false
Since we're mounting /monitoring/prometheus.yml into prometheus service, let's create the directory monitoring and create a file prometheus.yml inside the monitoring directory.
The contents of the prometheus.yml looks like this:
Once the docker-compose.yml is ready, start the services with docker-compose up
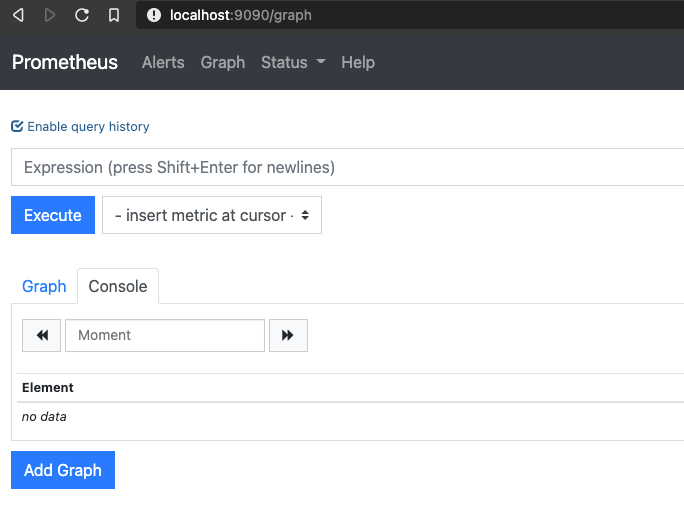
And when the services are up, visit http://localhost:9090/. You'll see something like this:
And if you navigate to http://localhost:9090/targets (Status dropdown -> Targets), you'll see something like this:
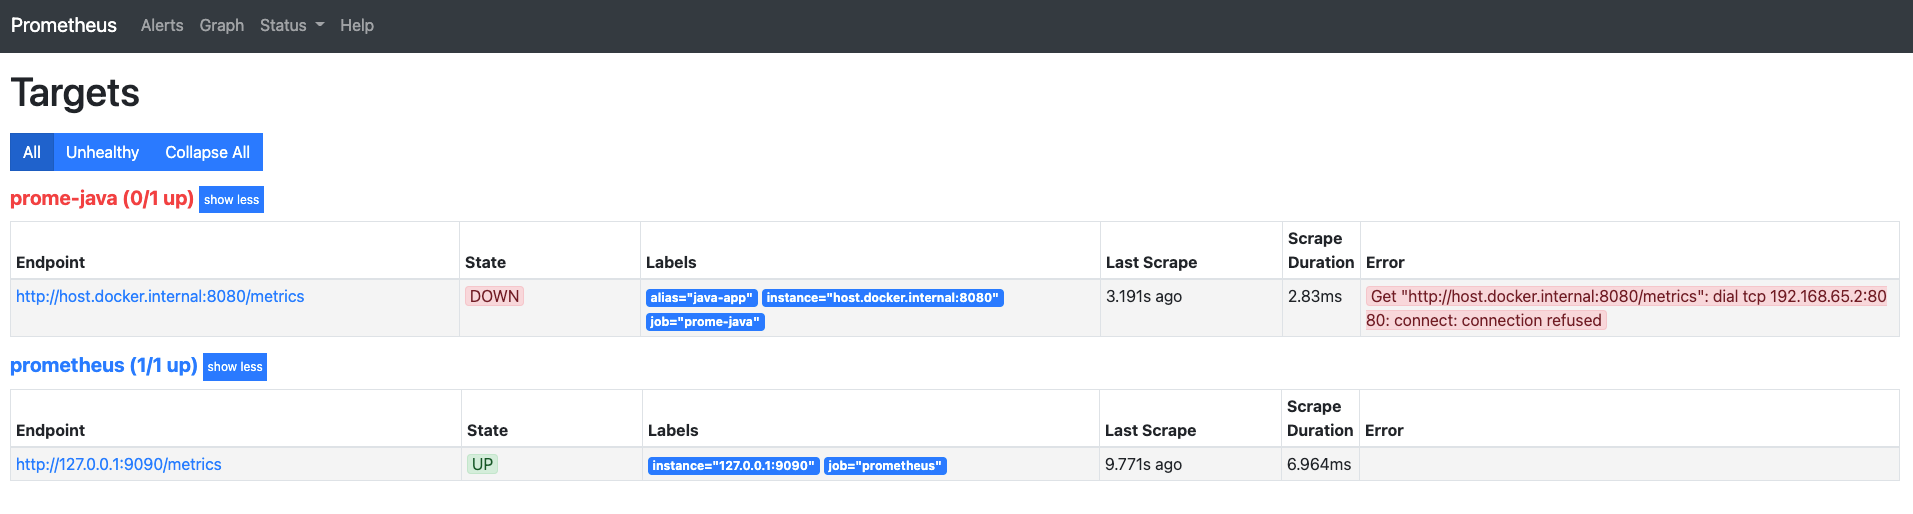
As you can see there's an error message that says:
Get "http://host.docker.internal:8080/metrics": dial tcp 192.168.65.2:8080: connect: connection refused
because our Java application is not running at the moment. We'll fix this a little letter.
If you visit http://localhost:3000/, you'll see the Grafana login page:
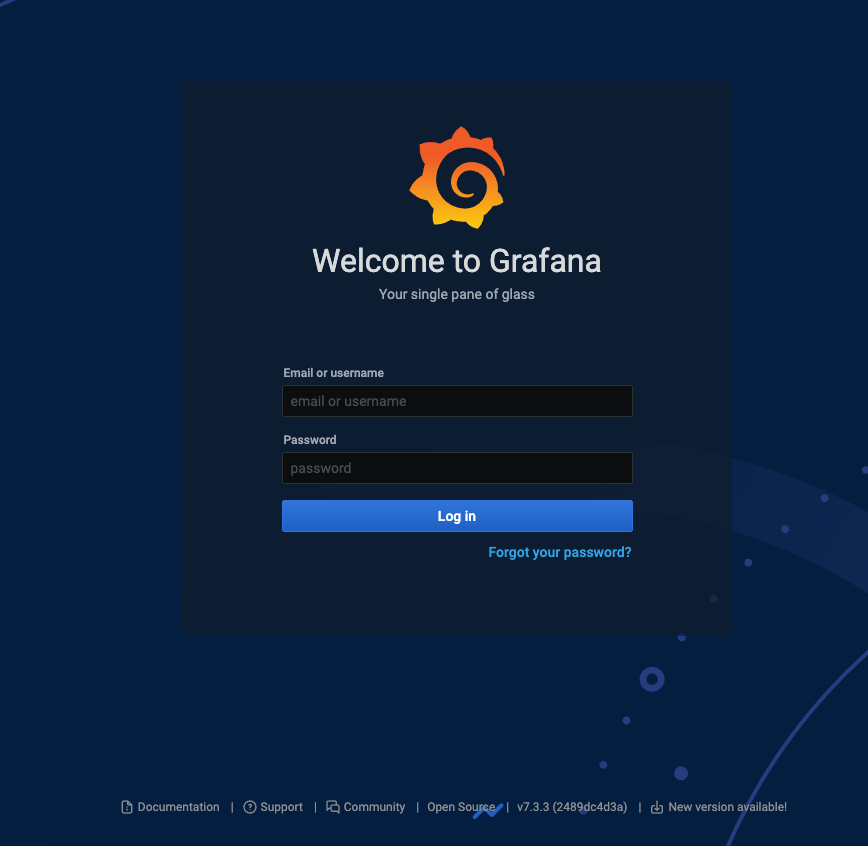
Use the default username: admin and password admin to get inside the Grafana dashboard. When asked to change password, skip it as it's just a local development environment. Obviously in production, this has to be more sure by enabling the login by Gmail or any other OAUTH mechanism.
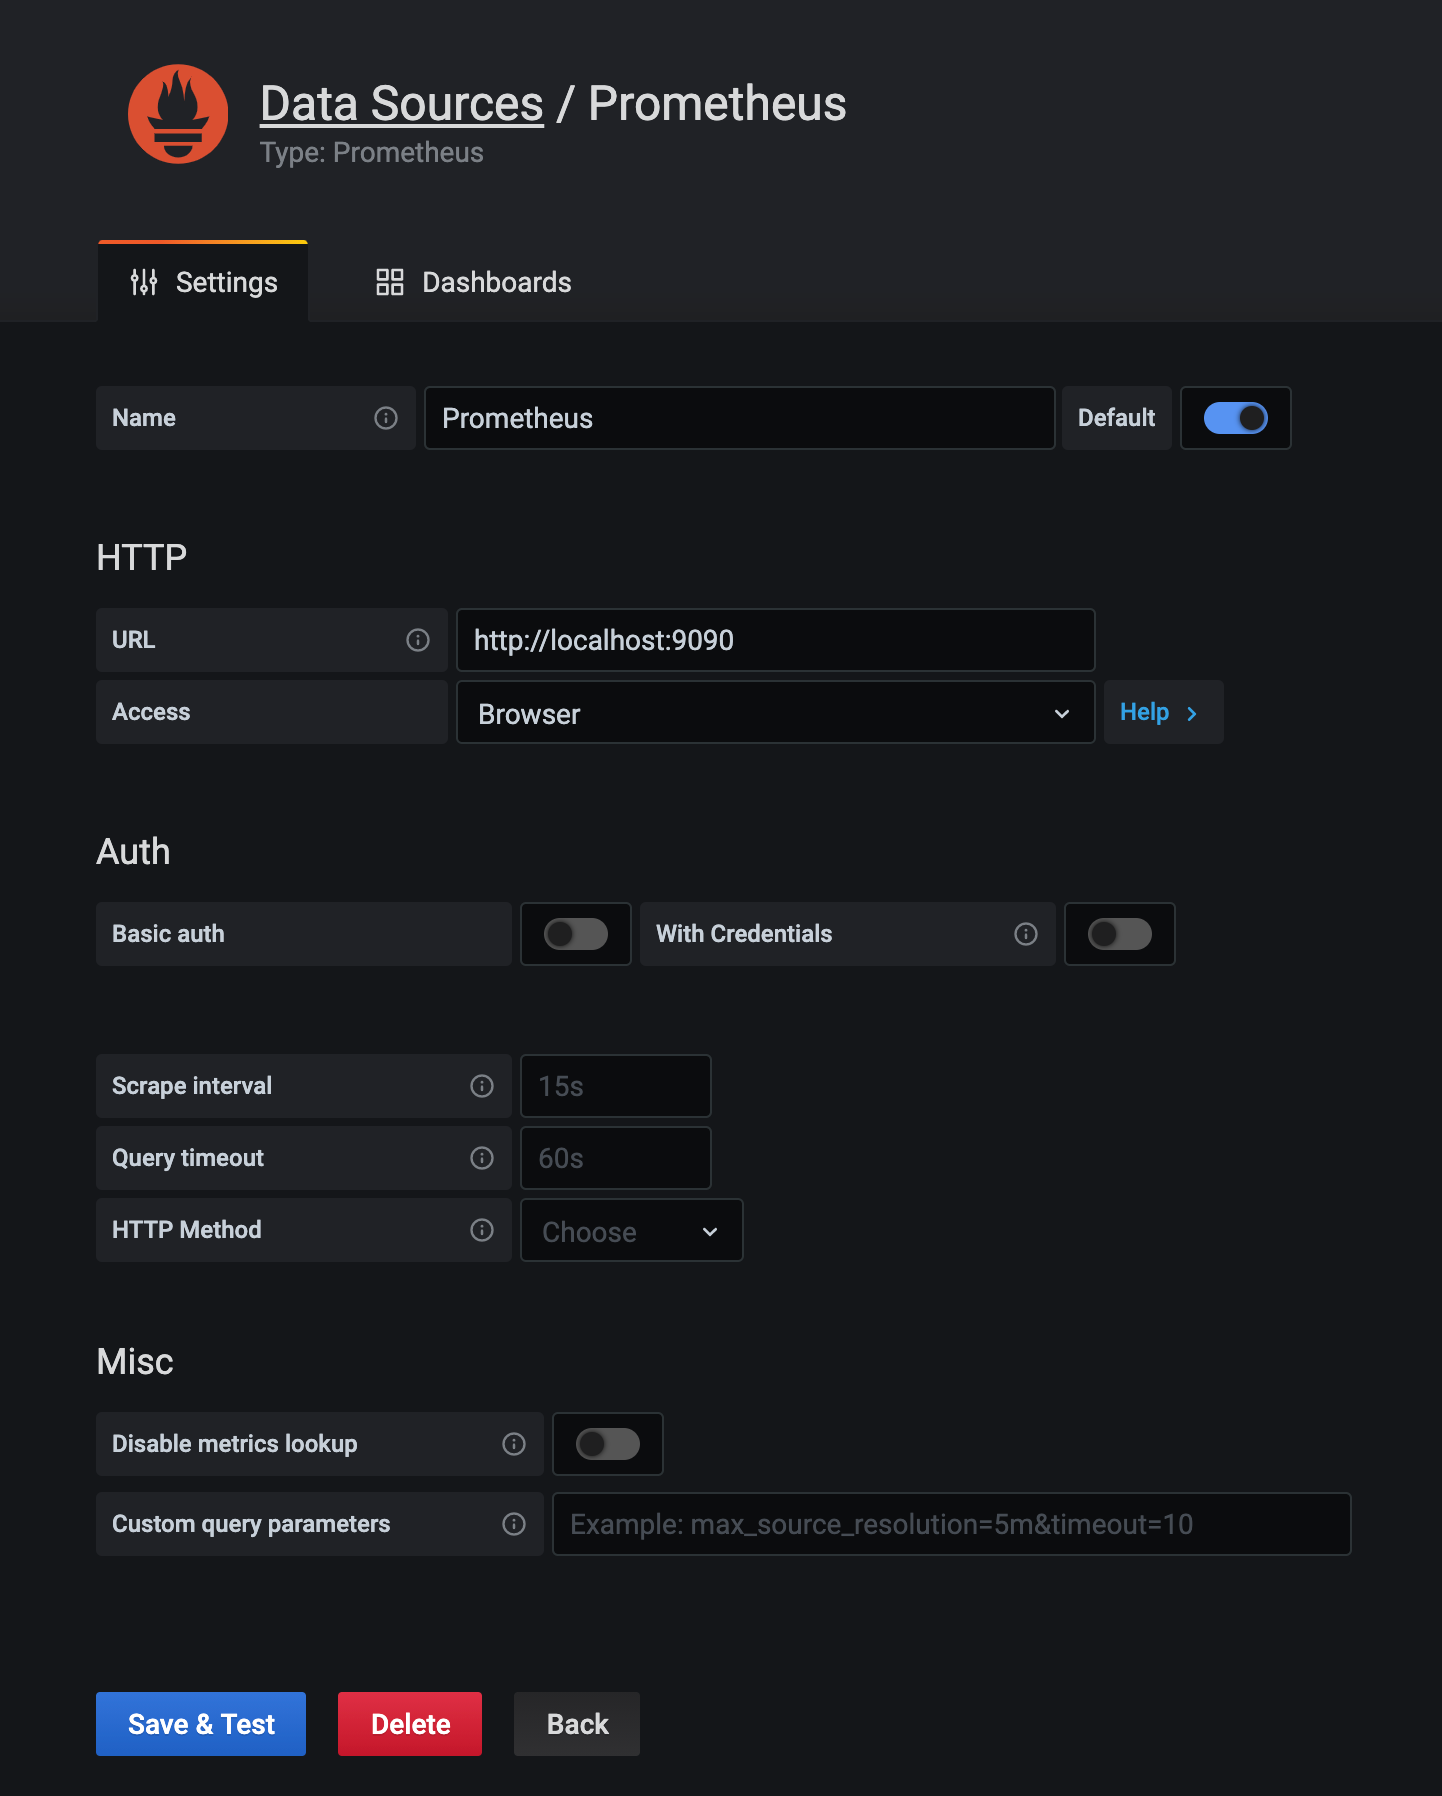
Now you need to add Prometheus data source so that our Grafana can get the piece of the metrics we're exposing. To add the datasource directly go to http://localhost:3000/datasources
Then click on Add data source button and fill up the form as shown in the screenshot below.
Step 2: Expose metrics from your Java application
- Create
MetricServiceclass which will provide the singleton instance ofPrometheusMeterRegistry
- Create HTTP metric endpoint where prometheus can go to scrape the metrics. As you can see in the
prometheus.ymlfile we've definedmetrics_path: "/metrics". So, let's create HTTP endpoint. I'll add this in theActuator.javafile:
- Create the Main class (the entry point to our application)
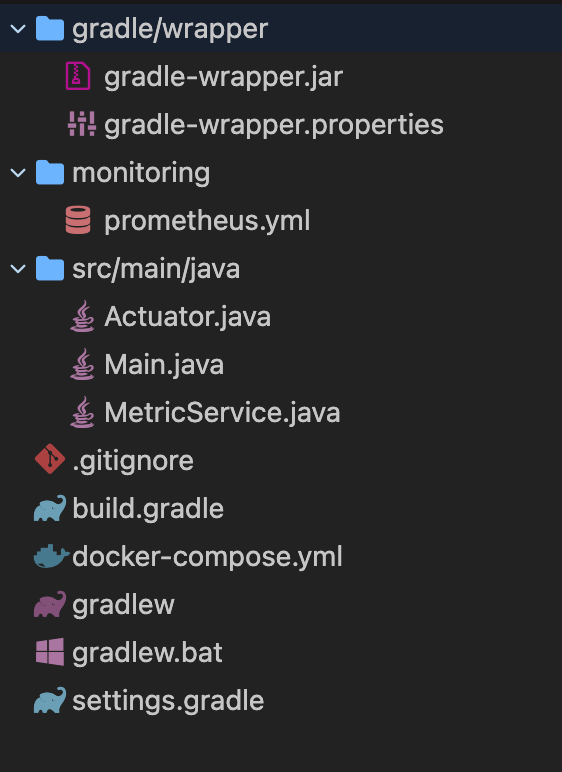
At this point, the source code directory looks like this:
Now if you run your application (Execute Main.java) and go to http://localhost:8080/metrics, you'll see following output:
...
# HELP jvm_gc_live_data_size_bytes Size of long-lived heap memory pool after reclamation
# TYPE jvm_gc_live_data_size_bytes gauge
jvm_gc_live_data_size_bytes 0.0
# HELP jvm_buffer_count_buffers An estimate of the number of buffers in the pool
# TYPE jvm_buffer_count_buffers gauge
jvm_buffer_count_buffers{id="mapped - 'non-volatile memory'",} 0.0
jvm_buffer_count_buffers{id="mapped",} 0.0
jvm_buffer_count_buffers{id="direct",} 2.0
# HELP jvm_memory_used_bytes The amount of used memory
# TYPE jvm_memory_used_bytes gauge
...
Which means your Java application is exposing metrics for the Prometheus to grab.
Step 3: Visualize the exposed metrics in Grafana
Since, we're only exposing JVM metrics for now let's see those exposed metrics on Grafana through a sweet dashboard.
Let's import the Micrometer grafana official dashboard. The ID of the grafana dashboard is 4701. So, let's import the dashboard to Grafana.
Click on the Import button which is shown in the screenshot below.
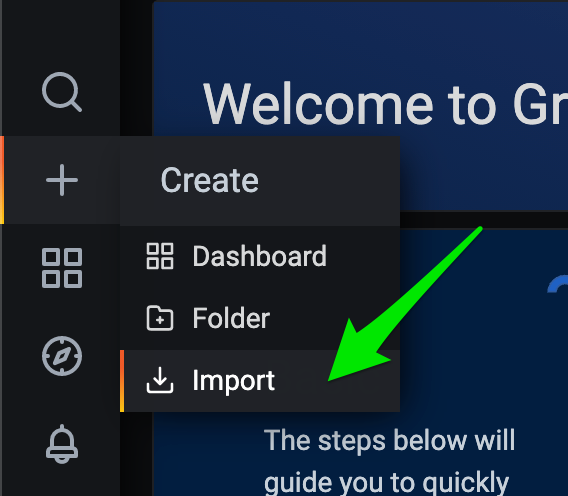
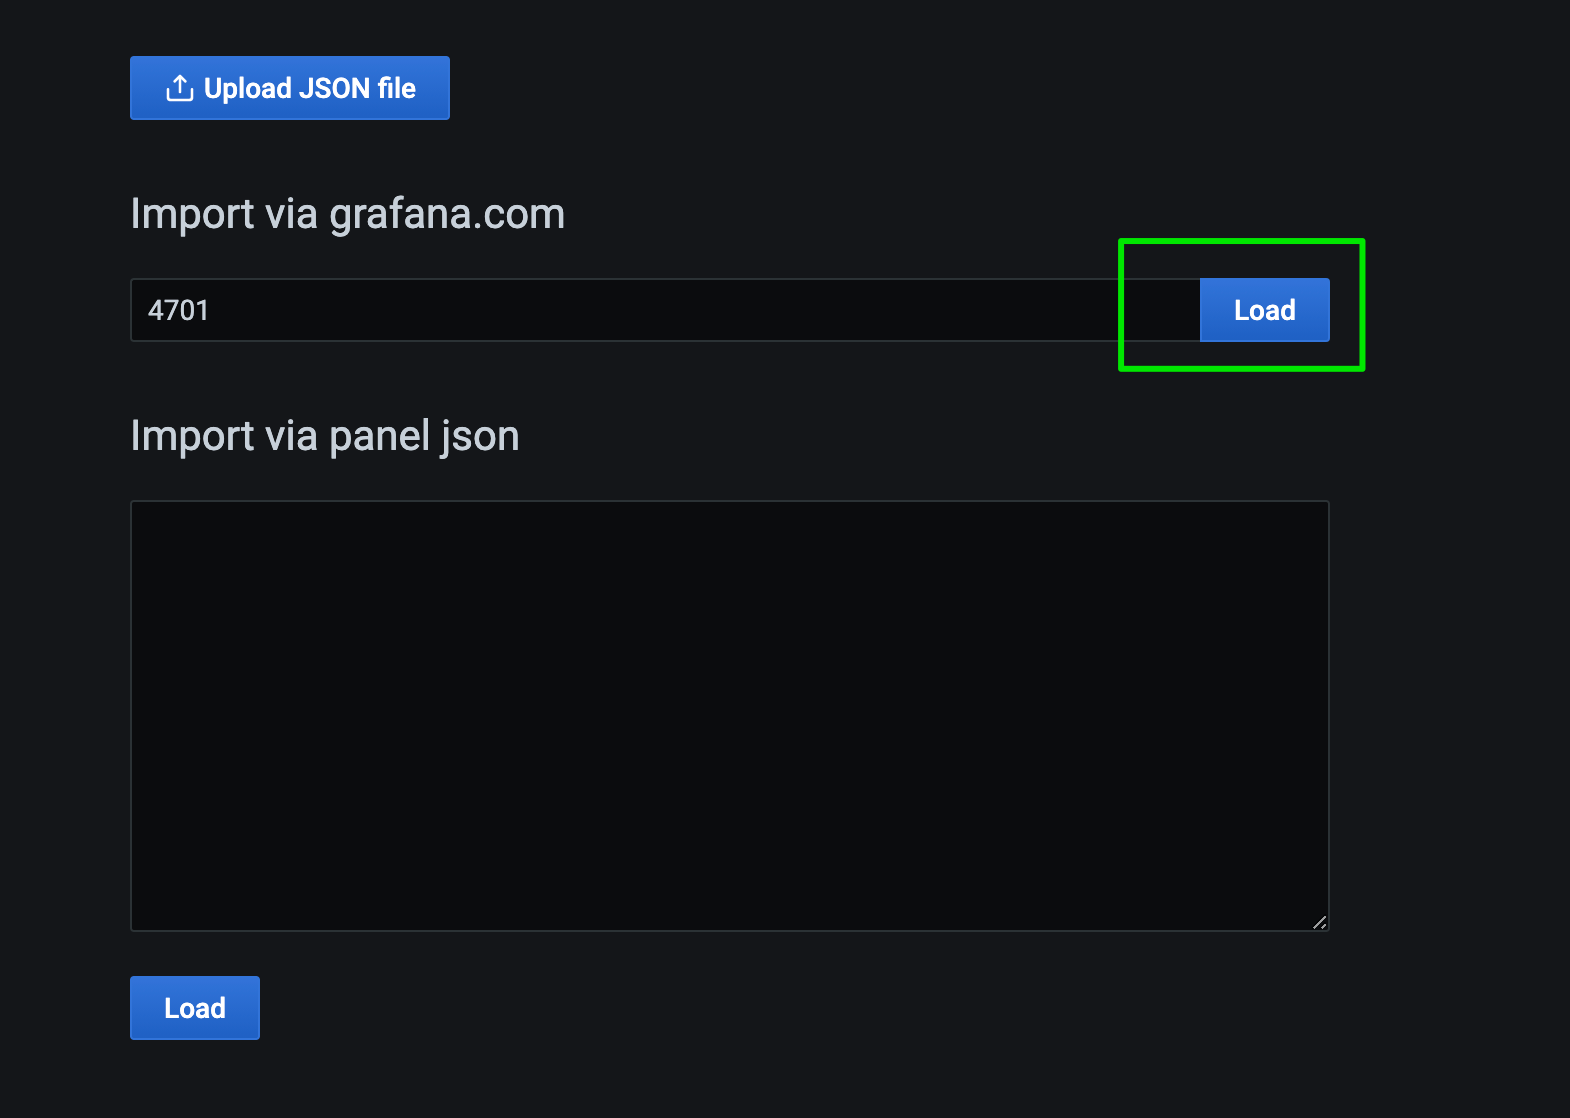
Type 4701 in the input field Import via grafana.com and click Load button.
Once, you click load, you'll see this page. Follow the 3 steps shown in the screenshot.
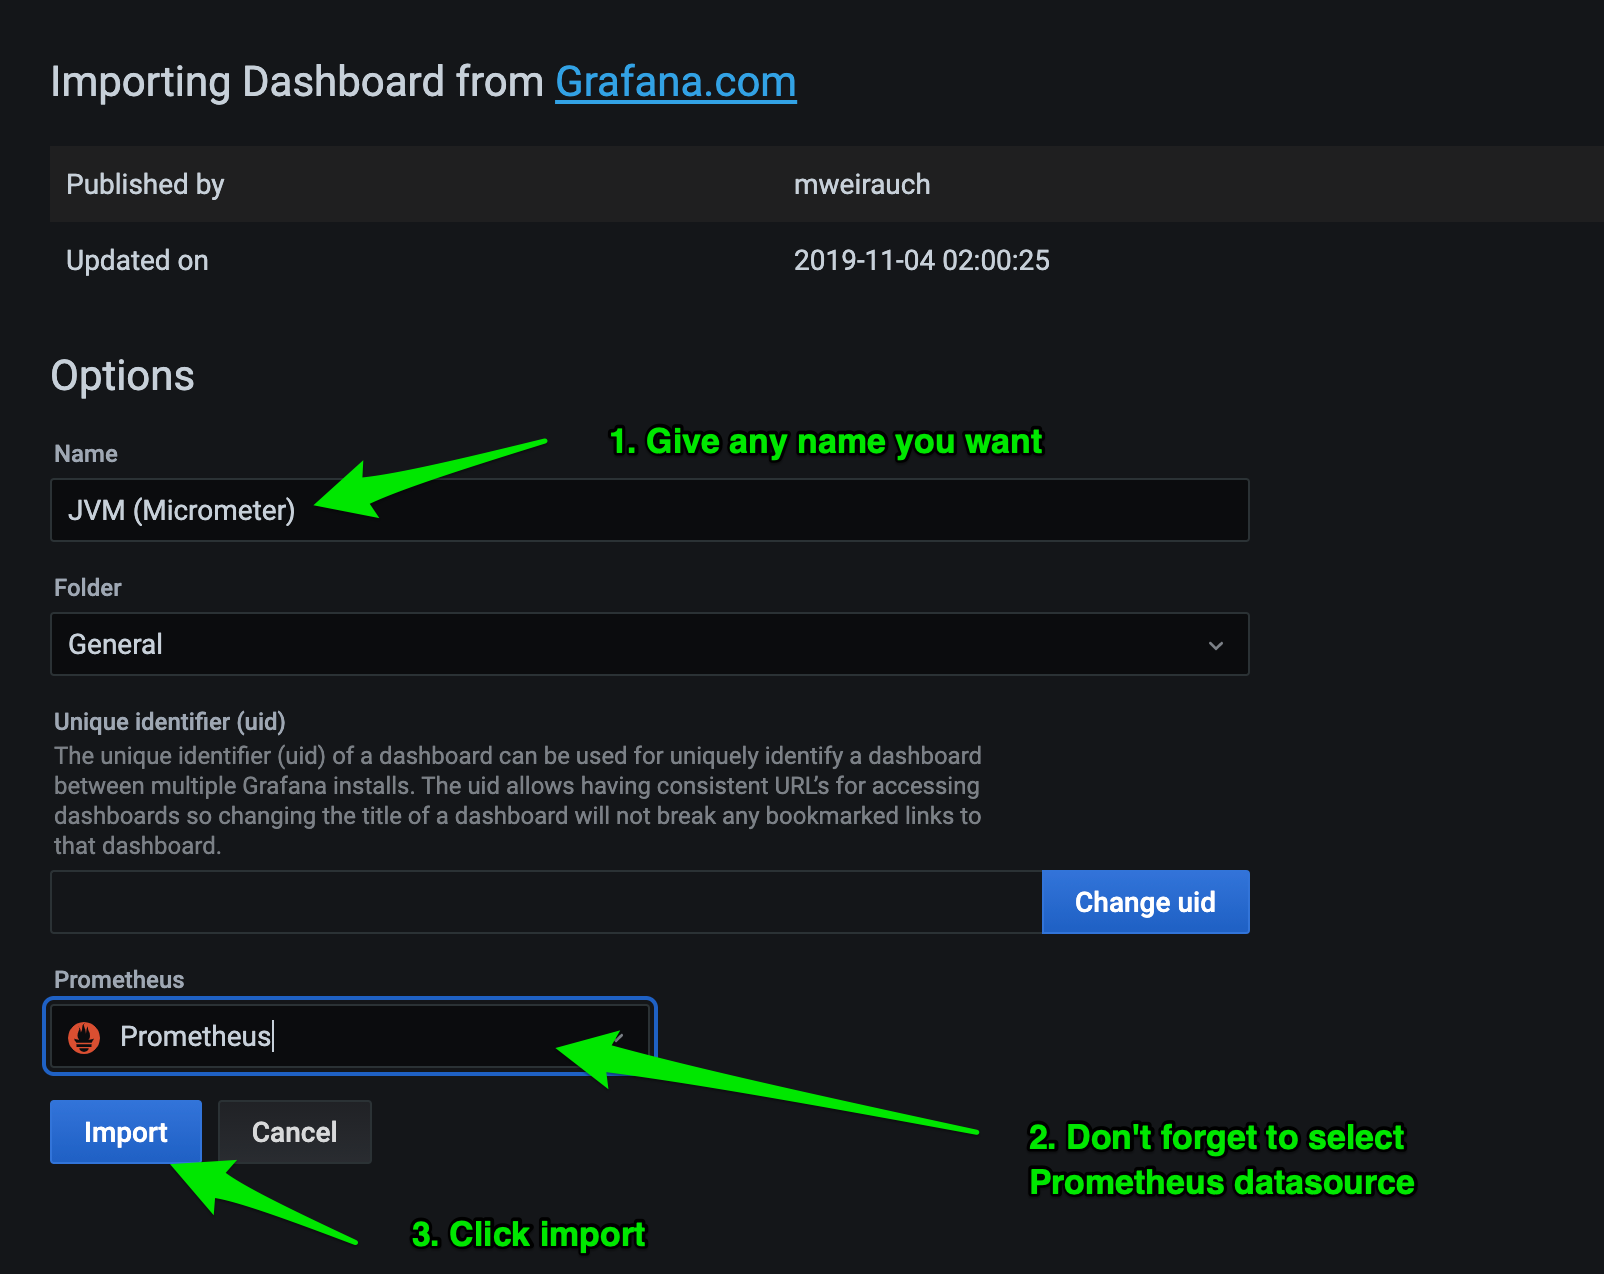
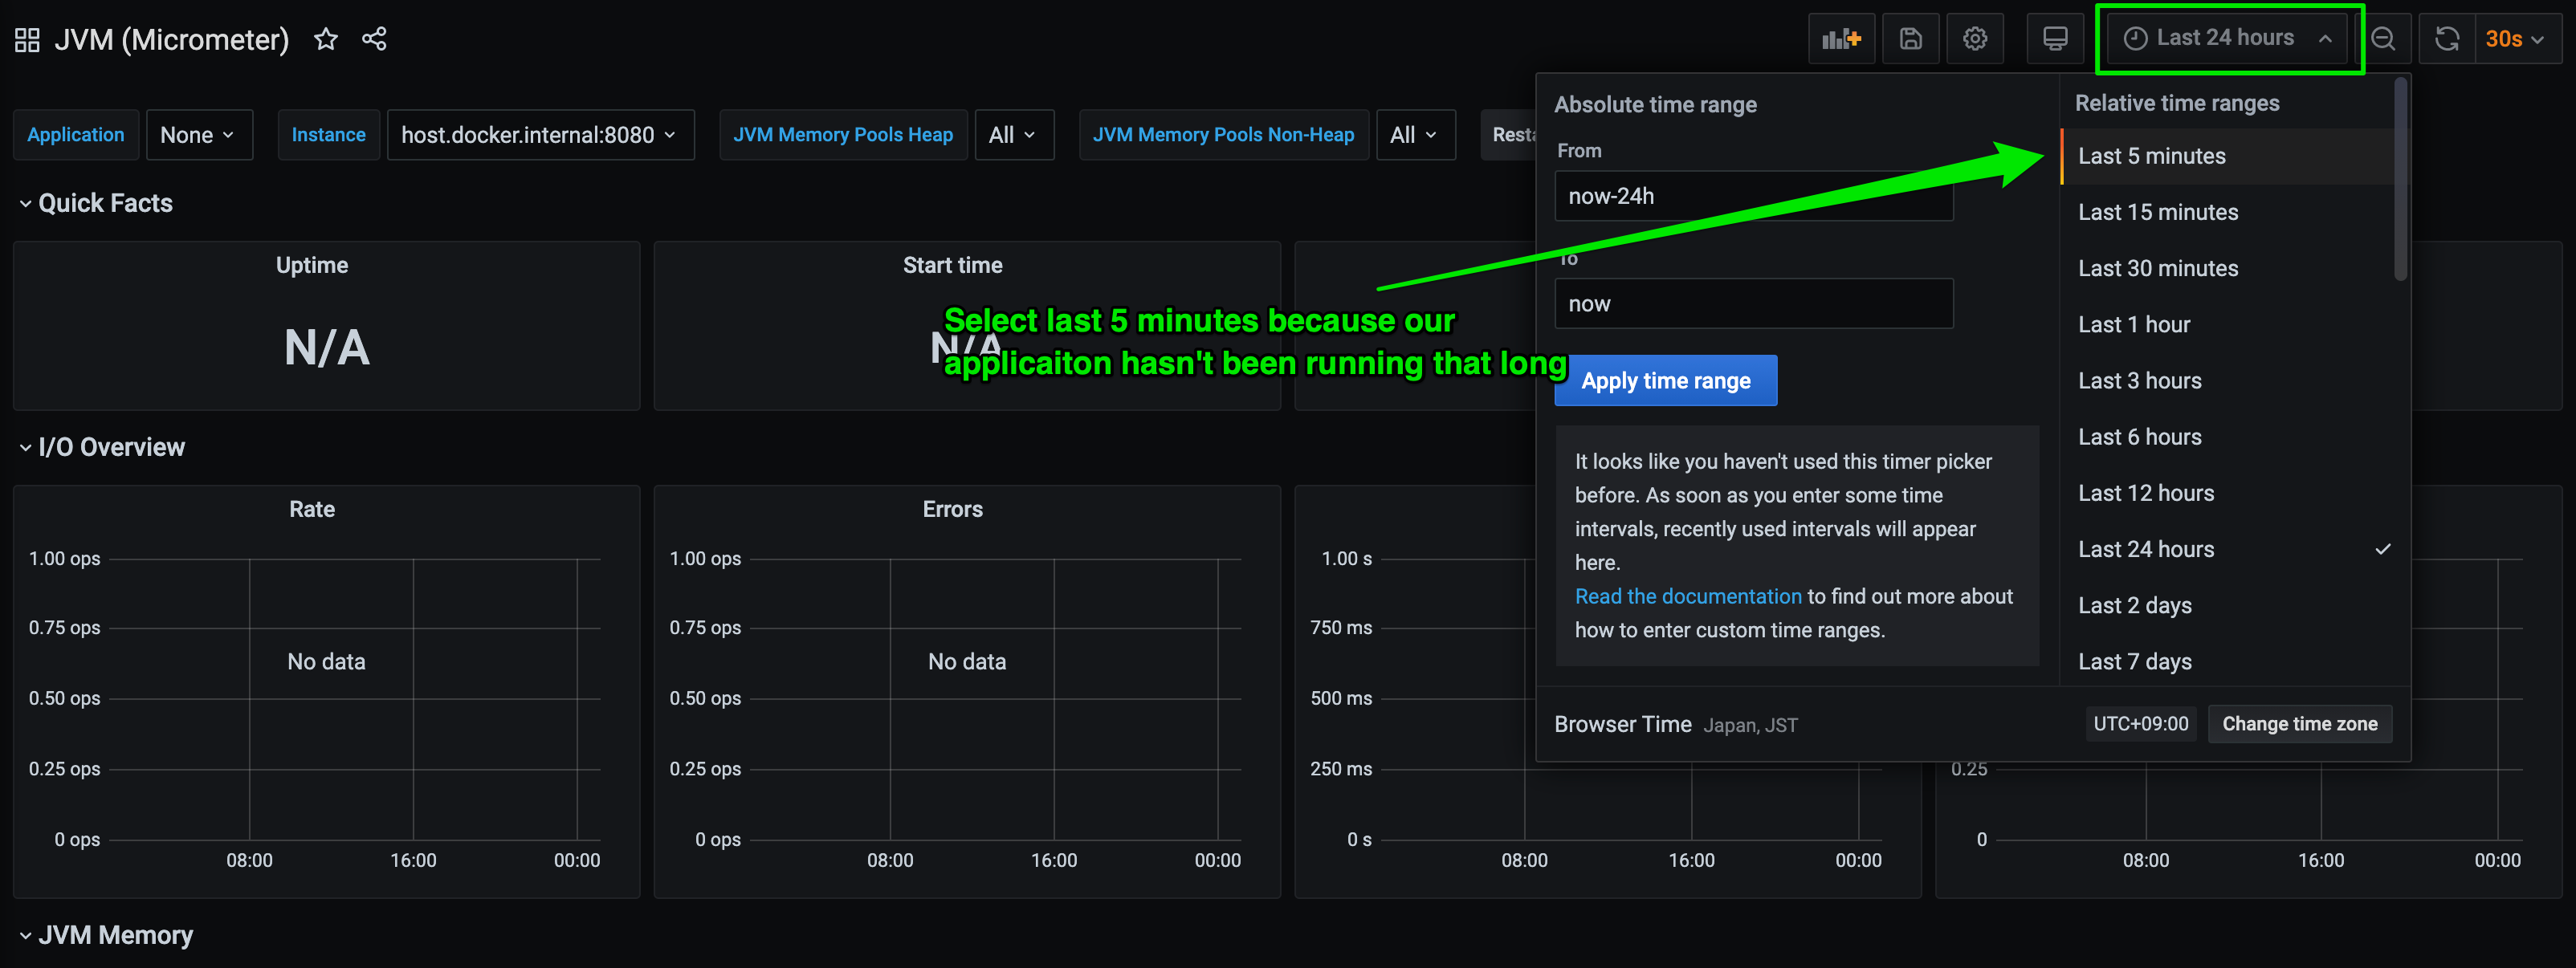
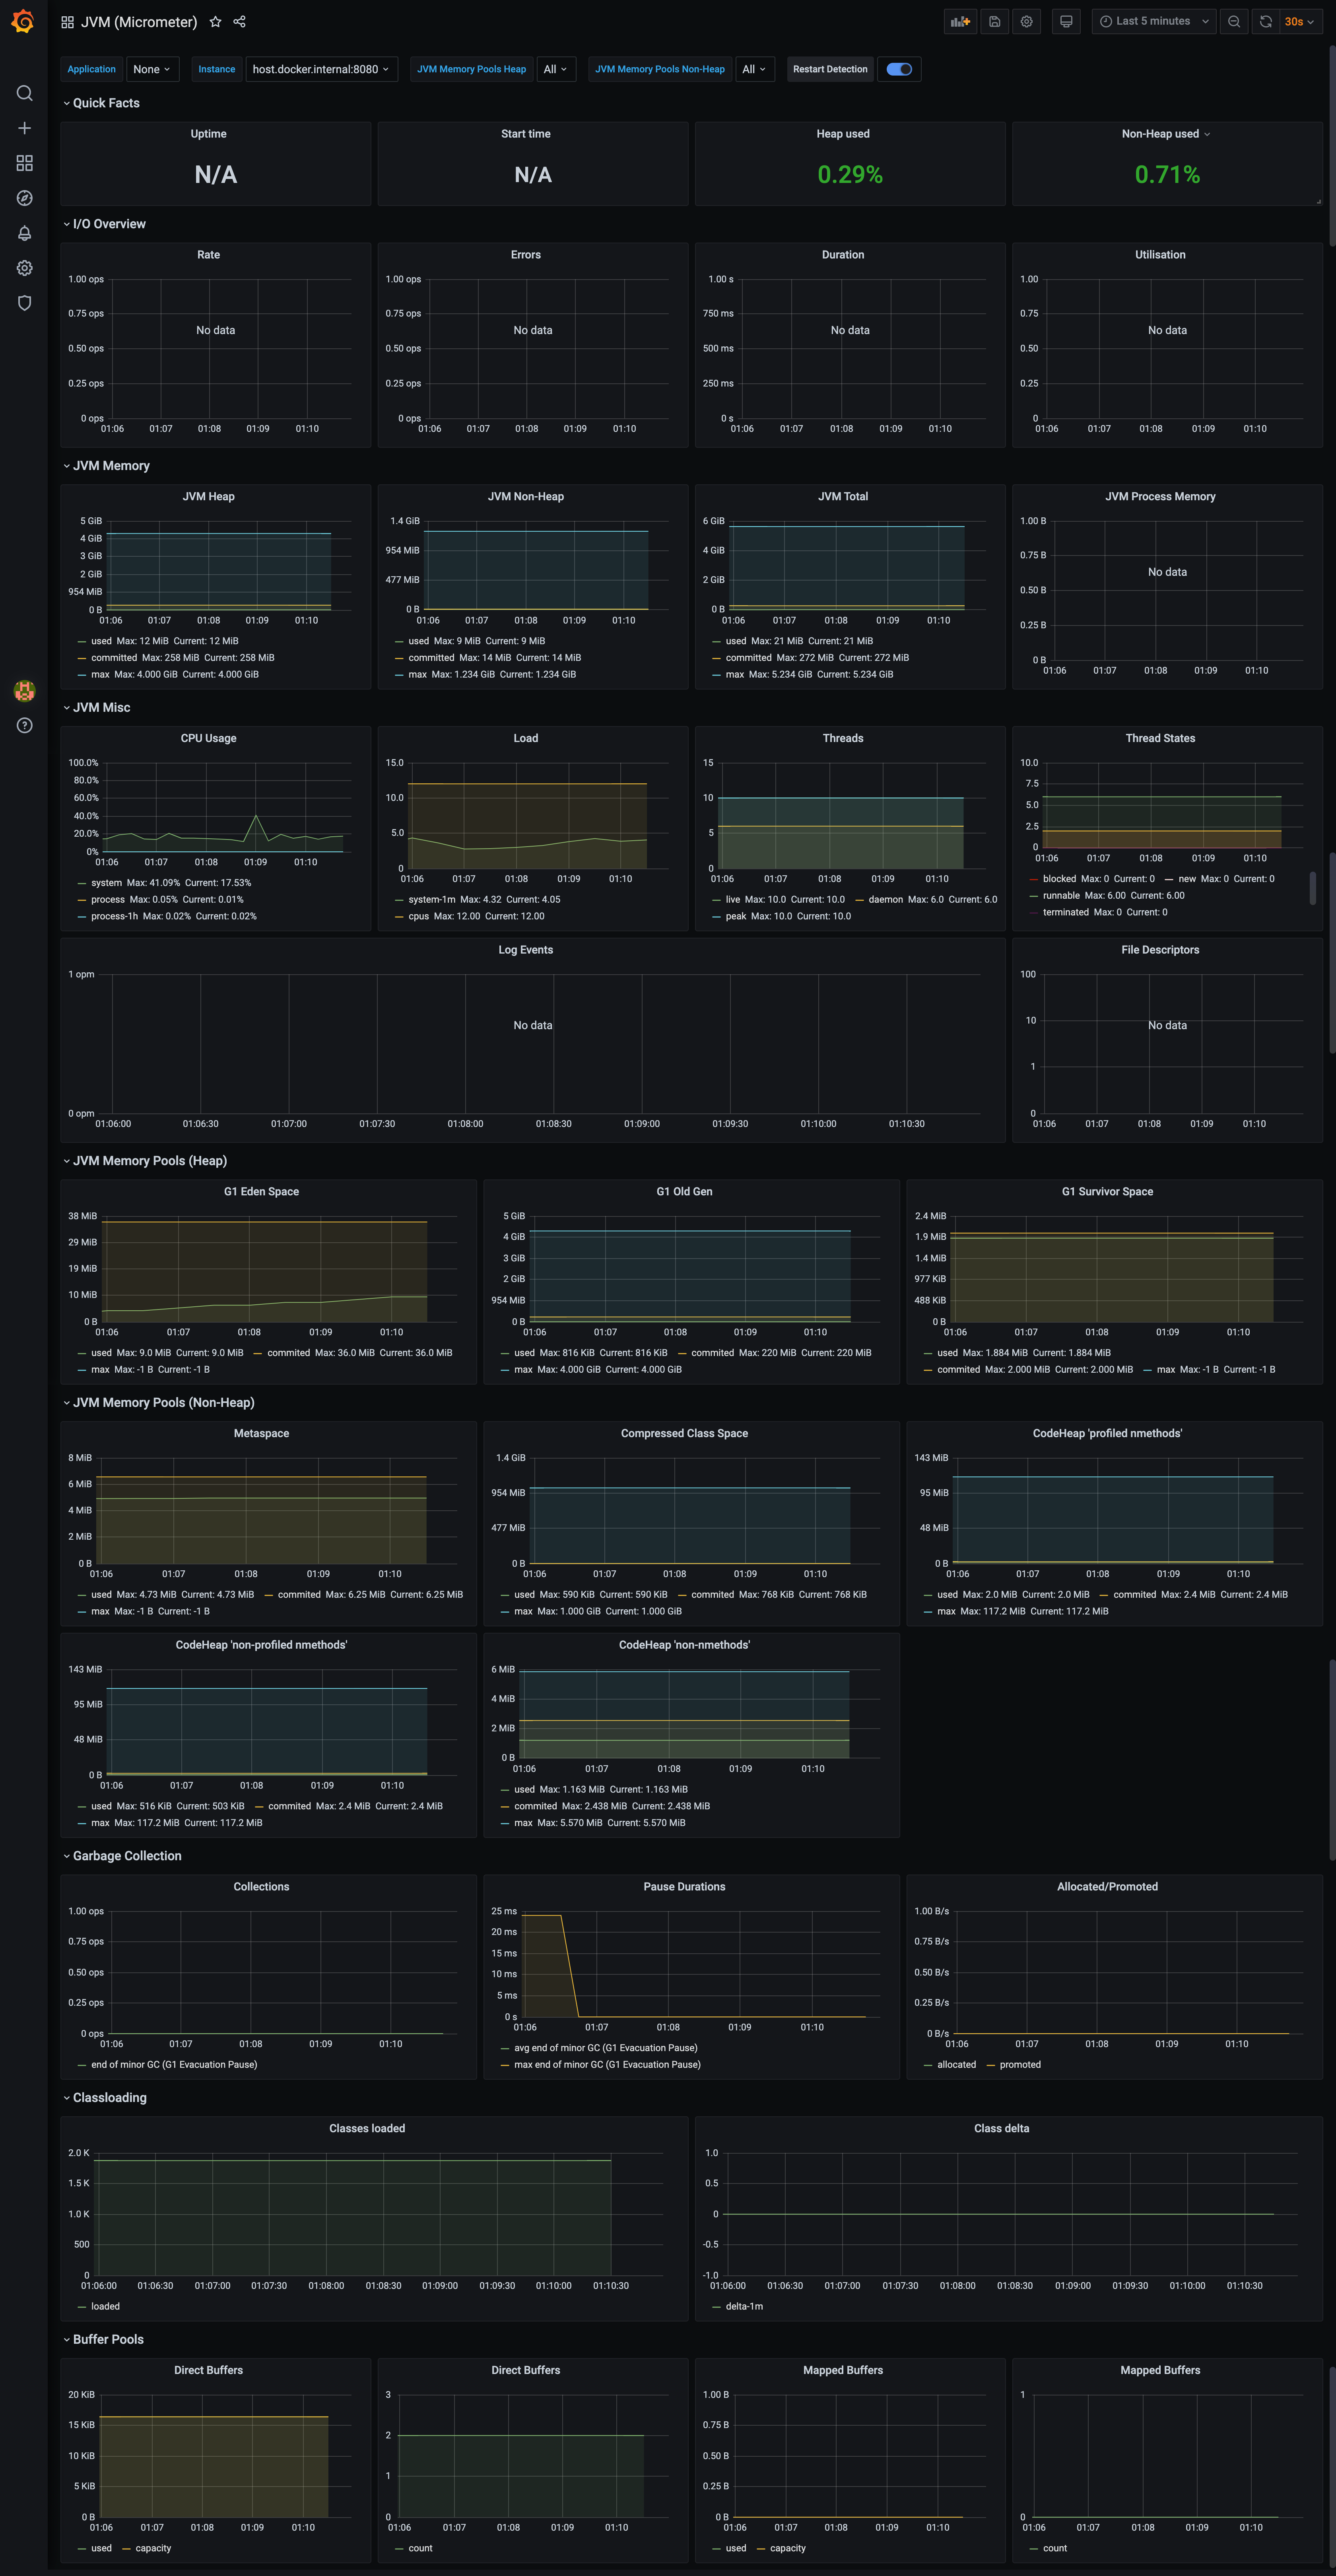
Now your dashboard is imported, change the date range to view recent data.
Congratulations!! your dashboard is fully functional and ready to use.
You can play with Prometheus and Grafana as much as you like because everything is running in local. Try creating some alerts, Prometheus rules, write some PROMQL and expose some other metrics with Micrometer.
If you want to take this to production, you can do it in various ways. Using K8s, using 3rd party service, hosting your own, using AWS managed service, etc. There are plethora of options, and you can choose any depending on your cost and requirements.
Going further
Now the basic setup is done, the metrics world does not stop here. It's a vast ocean. Here are some further additional resources which will help you to go forward.
- https://micrometer.io/docs/concepts
- https://prometheus.io/docs/prometheus/latest/getting_started/
- https://prometheus.io/docs/prometheus/latest/querying/basics/
- Video: PromQL for Mere Mortals
- Video: The 4 Types Of Prometheus Metrics
- https://www.robustperception.io/blog
- https://grafana.com/tutorials/
- https://github.com/prometheus/client_java
- https://www.reddit.com/r/PrometheusMonitoring -> Reddit community
- https://www.reddit.com/r/grafana -> Reddit community
- https://slofile.com/slack/micrometer-metrics -> Official Slack channel for Micrometer (Join and ask any questions related to Prometheus, Grafana and Micrometer)